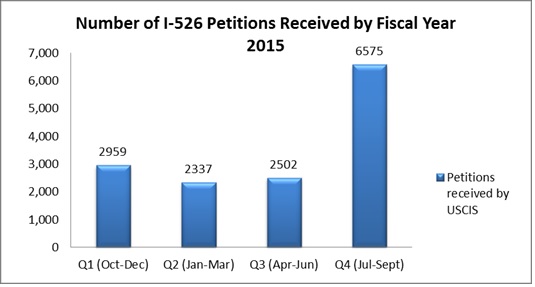
2015 has continued to mark another busy year for the EB-5 category. By the end of the fourth quarter of fiscal year 2015, there were 17,267 I-526 Petitions pending before USCIS.[1] In particular, petitions filed in the fourth quarter counted for approximately 38 percent of the total number of I-526 Petitions filed in this fiscal year. This sharp increase was due to the expiration of the EB-5 program on Sept. 30, 2015 and the unprecedented number of filings submitted before the anticipated sunset date. Now that the EB-5 program is extended until Sept. 30, 2016, we expect to see a spike of I-526 Petition filings towards the expiration date.

In addition to the USCIS’s published I-526 Petition filing statistics, the Department of State also published an annual report on visas issued in fiscal year 2015, which provides statistical data for the EB-5 category according to the recipients’ countries of origin. Herein, we tabulate and compare data from two fiscal years, to present a snapshot of EB-5 investor trends over the last two years.
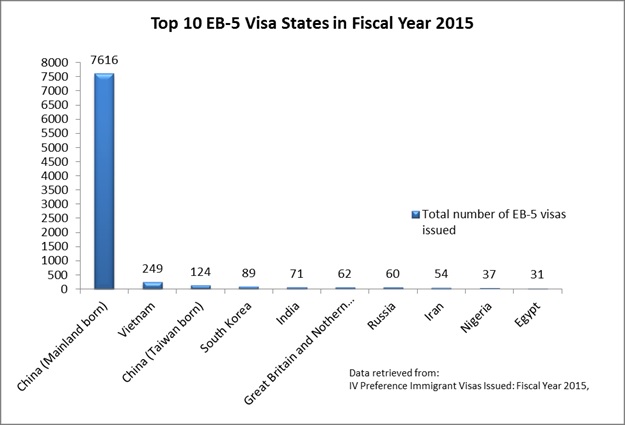
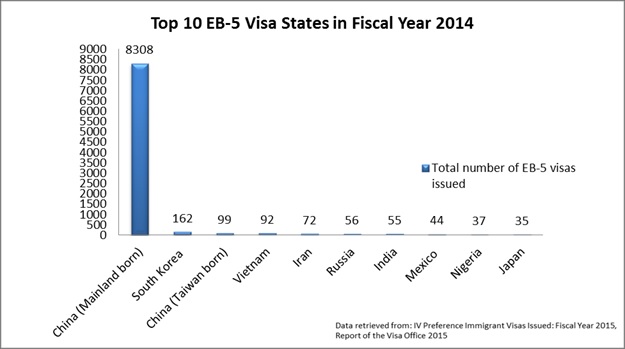
The following charts rank the Top 10 foreign states based on the number of EB-5 visas issued in that fiscal year; we first turn to the data from fiscal year 2015. Visas issued to China mainland born investors continued to be the top-ranked in 2015, with 7,616 total visas. This however, has declined slightly from the previous year, which was 8,303. In 2014, South Korea was the second foreign state for the total number of EB-5 visas issued; in 2015, it drops to fourth place and the number of visas issued almost decreased by half.
Among the top states, Vietnam had the largest increase in the fraction of overall EB-5 immigrants between 2014 and 2015, and the total number of EB-5 immigrant visas for Vietnam investors has almost tripled, with an increase from 92 to 249. While this growth is significant, it also is a long way away from the leading EB-5 market — China.
While the visa numbers for Iran, Russia and Nigeria remained relatively steady, Great Britain and Northern Ireland have experienced a sharp increase in EB-5 immigrants. They were not on the top ten states in 2014, and were ranked sixth in fiscal year 2015.


Despite the slight decline from fiscal year 2014, Chinese investors still made up the greatest percentage (86.8 percent) of total EB-5 immigrant visas issued in 2015.[2] The statistics show that the EB-5 category continues to thrive in Asian countries, with a growth of interest in the EB-5 visa from Great Britain and Northern Ireland. In 2016, it will be interesting to see how Chinese retrogression and impending legislative changes impact demand levels.
[1] See USCIS Form I-526 Immigration Petition by Alien Entrepreneur (Fiscal Year 2015, 4th Qtr), available at: https://www.uscis.gov/sites/default/files/USCIS/Resources/Reports%20and%20Studies/Immigration%20Forms%20Data/Employment-based/I526_performancedata_fy2015_qtr4.pdf.
[2] See id.
DISCLAIMER: The views expressed in this article are solely the views of the author and do not necessarily represent the views of the publisher, its employees. or its affiliates. The information found on this website is intended to be general information; it is not legal or financial advice. Specific legal or financial advice can only be given by a licensed professional with full knowledge of all the facts and circumstances of your particular situation. You should seek consultation with legal, immigration, and financial experts prior to participating in the EB-5 program Posting a question on this website does not create an attorney-client relationship. All questions you post will be available to the public; do not include confidential information in your question.


